前言:最重要的第一步:安装echarts
npm install echarts --save
其他安装方式请到echarts官网查看
一、引入折线图
利用ref获取div容器
1.先准备一个容器
<div id="chartLineBox1" style="width: 90%;height: 70vh;"> </div>
2.在mounted钩子函数中书写以下代码
let chartLine = echarts.init(document.getElementById('chartLineBox1'));
// 指定图表的配置项和数据
var option = {
title:{
show:true,
text:'周屠宰量',
x:'center'
},
tooltip: { //设置tip提示
trigger: 'axis'
},
legend: { //设置区分(哪条线属于什么)
data:['2021年周屠宰量','2022年周屠宰量','2023年周屠宰量'],
bottom:'0'
},
//切换折线图,柱形图,刷新等设置
toolbox: {
show: true,
feature: {
mark : { // '辅助线开关'
show: true
},
dataZoom: {
yAxisIndex: 'none'
}, //区域缩放,区域缩放还原
dataView: {
readOnly: false
}, //数据视图
magicType: {
type: ['line', 'bar']
}, //切换为折线图,切换为柱状图
restore: {}, //还原
saveAsImage: {} //保存为图片
}
},
color: ['#8AE09F', '#FA6F53','#409EFF'], //设置区分(每条线是什么颜色,和 legend 一一对应)
xAxis: { //设置x轴
type: 'category',
boundaryGap: false, //坐标轴两边不留白
data: dataindex,
axisLine: { //坐标轴轴线相关设置。
lineStyle: {
// color: '#FA6F53',
}
}
},
yAxis: {
name: '单位:元/公斤',
nameTextStyle: {
// color: '#FA6F53',
fontSize: 16,
padding: [0, 0, 10, 0]
},
axisLine: {
lineStyle: {
// color: '#FA6F53',
}
},
type: 'value'
},
series: [
{
name: '2021年周屠宰量',
data: tzl1_numData,
type: 'line', // 类型为折线图
symbol:'circle',
symbolSize:10,
lineStyle: { // 线条样式 => 必须使用normal属性
normal: {
color: '#8AE09F',
}
},
},
{
name: '2022年周屠宰量',
data: tzl2_numData,
type: 'line',
symbol: 'triangle', // 数据级个性化拐点图形 rect矩形
symbolSize : 10,
lineStyle: {
normal: {
color: '#FA6F53',
}
},
},
{
name: '2023年周屠宰量',
data: tzl3_numData,
type: 'line',
symbol: 'rect',
symbolSize : 10,
lineStyle: {
normal: {
color: '#409EFF',
}
},
}
]
};
// 清空画布
chartLine.clear();
// 使用刚指定的配置项和数据显示图表。
chartLine.setOption(option);
3.部分说明
axisLabel 可以设置x、y轴刻度上文本的样式,如大小、颜色、字体样式;
boundaryGap 是两侧留白,决定着文字是否在刻度中间还是在刻度正下方;
利用 id 获取容器


二、把折线图拐点设置成图片样式
1.先引入图片
import chart_circle from '../../assets/images/section_right/chart_circle.png';
2.然后定义变量(如果在另一个文件定义这个变量,要记得使用export default 导出)
const chartCircle = 'image://' + chart_circle;
3.最后使用变量
symbol: chartCircle

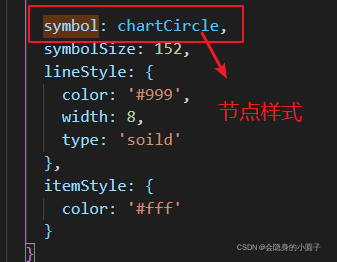
效果展示:

参考文章
https://blog.csdn.net/yue31313/article/details/122453241
三、给折线图设置背景颜色
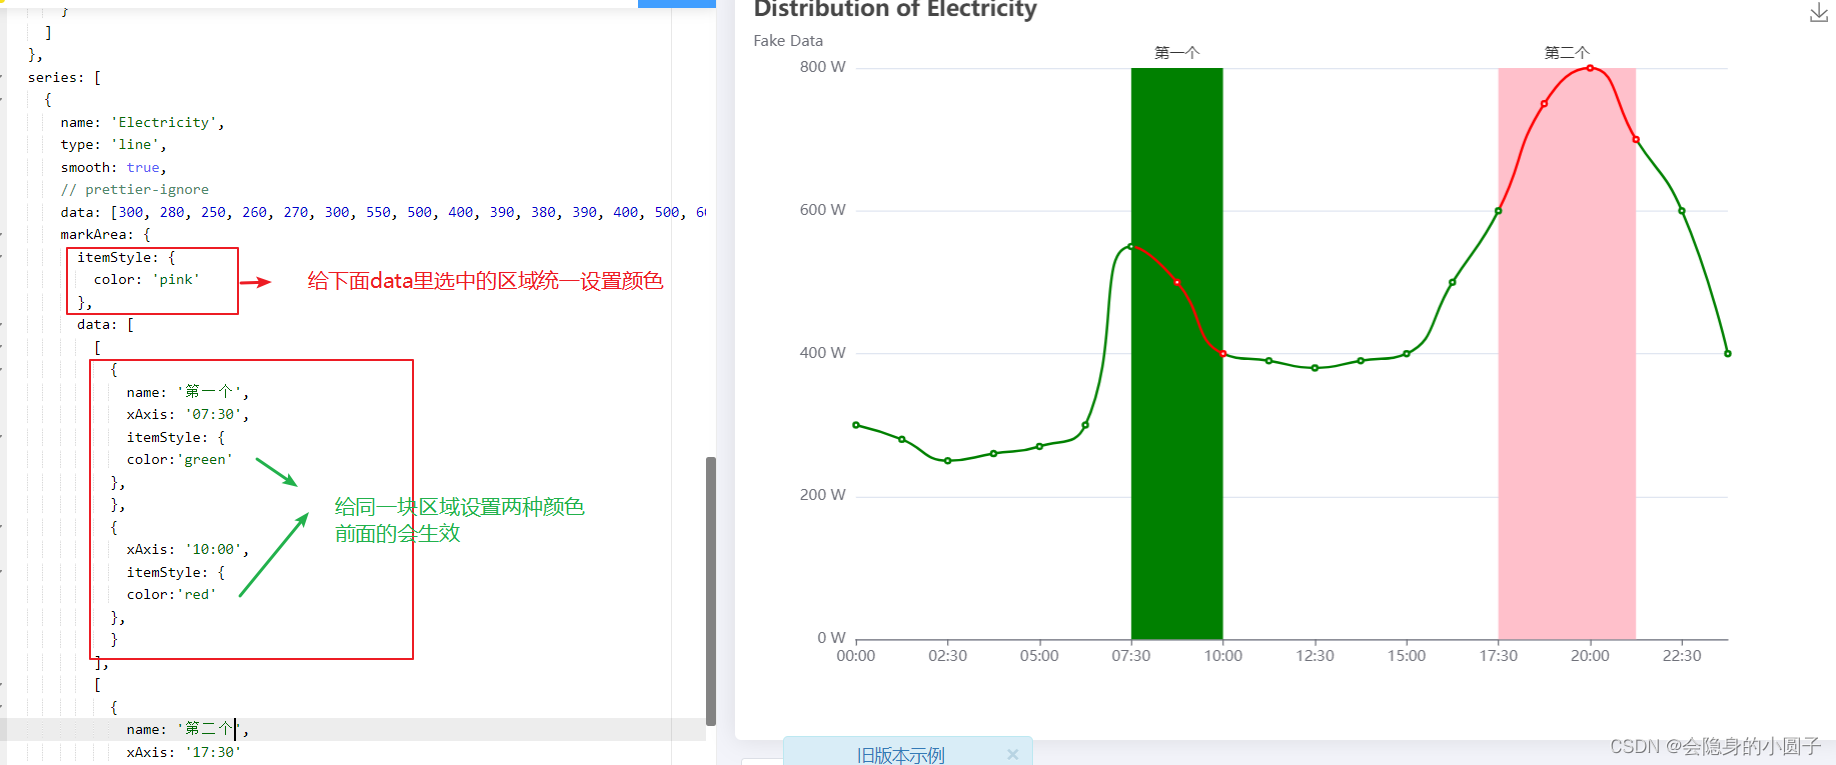
1.单一背景色
markArea 里的 itemStyle 属性,如果需要分别设置颜色就将itemStyle属性写到markArea下对应data里
2.渐变背景色
(1)给data里所有选中区域设置背景颜色
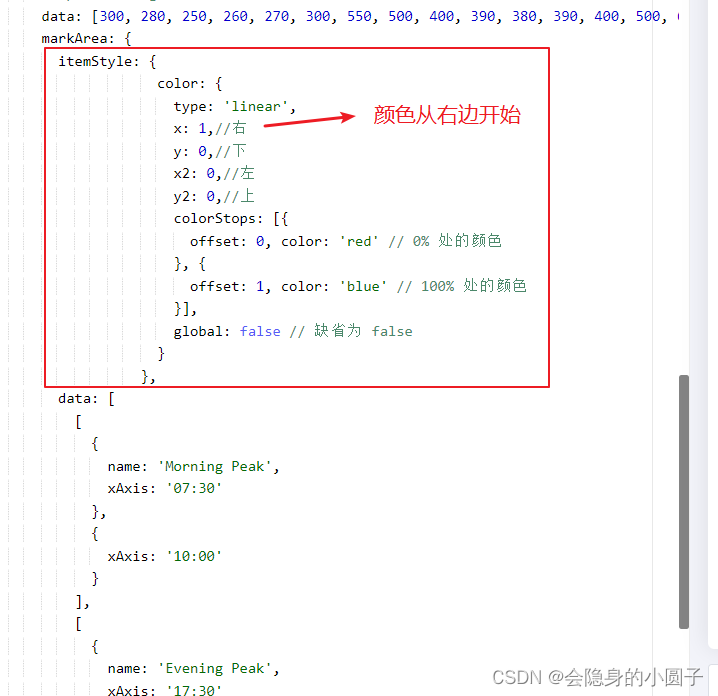
效果如下
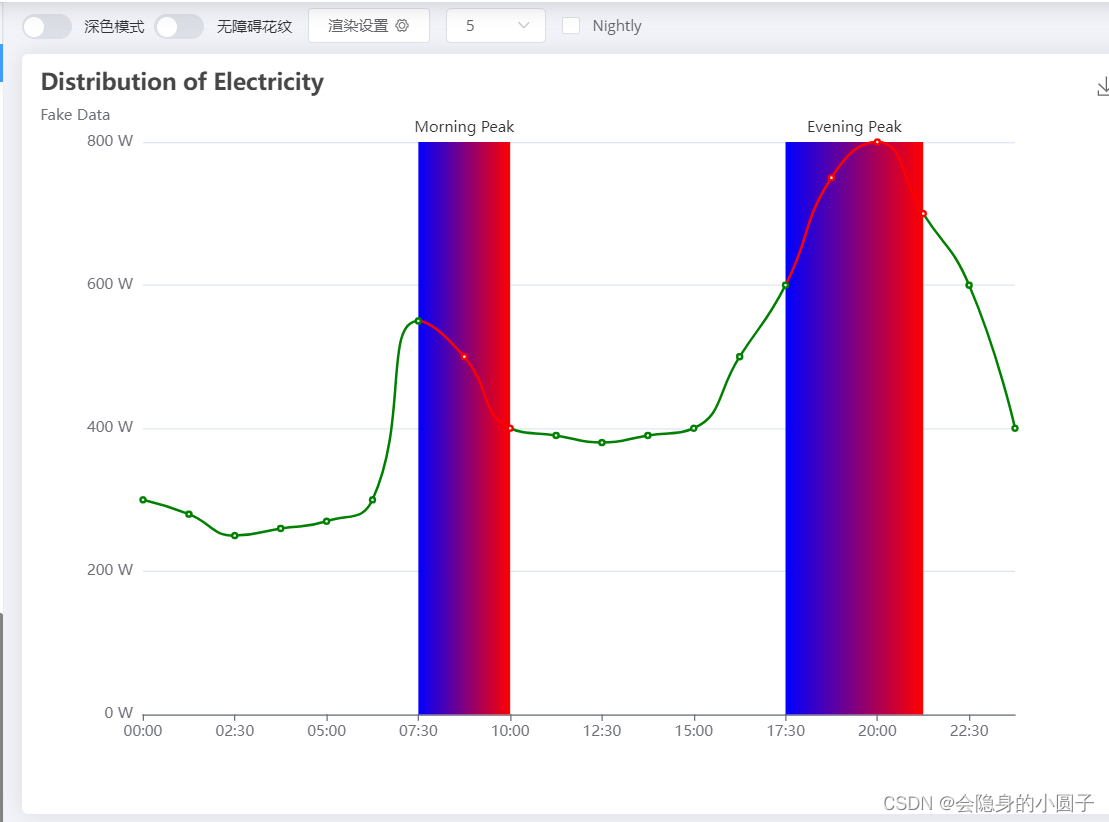
(2)分别给每一块区域设置背景颜色
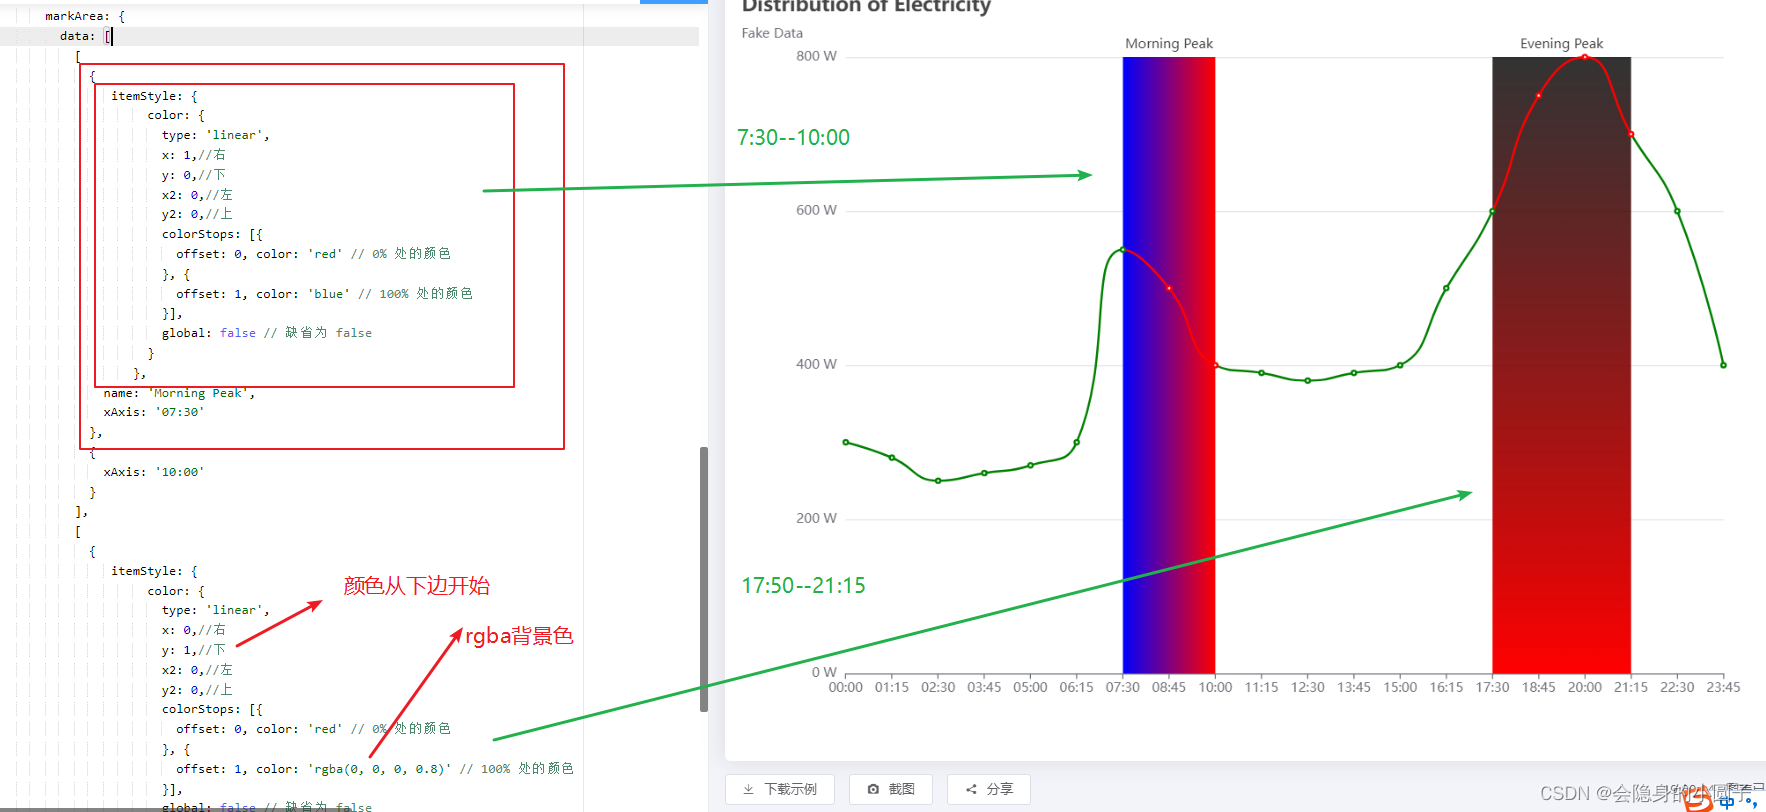
代码如下:
series: [
{
name: 'Electricity',
type: 'line',
smooth: true,
// prettier-ignore
data: [300, 280, 250, 260, 270, 300, 550, 500, 400, 390, 380, 390, 400, 500, 600, 750, 800, 700, 600, 400],
markArea: {
data: [
[
{
itemStyle: {
color: {
type: 'linear',
x: 1,//右
y: 0,//下
x2: 0,//左
y2: 0,//上
colorStops: [{
offset: 0, color: 'red' // 0% 处的颜色
}, {
offset: 1, color: 'blue' // 100% 处的颜色
}],
global: false // 缺省为 false
}
},
name: 'Morning Peak',
xAxis: '07:30'
},
{
xAxis: '10:00'
}
],
[
{
itemStyle: {
color: {
type: 'linear',
x: 0,//右
y: 1,//下
x2: 0,//左
y2: 0,//上
colorStops: [{
offset: 0, color: 'red' // 0% 处的颜色
}, {
offset: 1, color: 'rgba(0, 0, 0, 0.8)' // 100% 处的颜色
}],
global: false // 缺省为 false
}
},
name: 'Evening Peak',
xAxis: '17:30'
},
{
xAxis: '21:15'
}
]
]
}
}
]
四、补充内容
由于整个页面进行了zoom:0.5缩放,导致折线图点击事件出现问题。
只需要在折线图所在div书写zoom:2,并且把所有数据都缩小两倍(宽高、具体配置项等)